Japan's cherry blossom: as indisputable as climate change evidence gets
This year, Japan's earliest cherry blossom in 1,200 years made headlines around the world. And rightly so. Apart from being (as far as I can tell) a truly unparalleled feat of long-term record-keeping, it's also a uniquely strong piece of evidence in the case for man-made climate change.
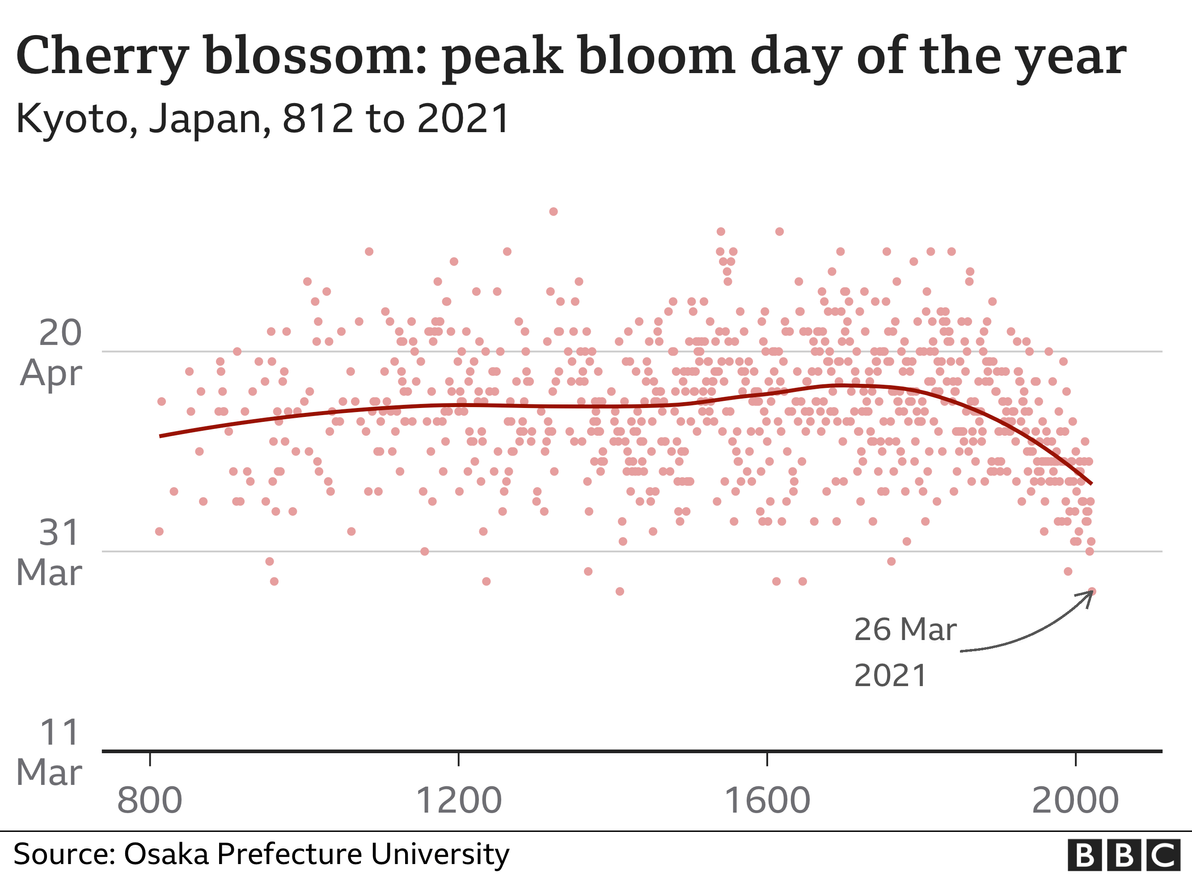
Image source: BBC News
I just want to briefly dive in to the data set (and the academic research behind it), and to explain why, in my opinion, it's such a gem in the sea of modern-day climate science.
Can we trust this data?
Green-minded lefties (of whom I count myself one) would tend to trust this data, without feeling the need to dig any deeper into where it came from, nor into how it got collated. However, putting myself in the shoes of a climate change sceptic, I can imagine that there are plenty of people out there who'd demand the full story, before being willing to digest the data, let alone to accept any conclusions arising from it. And hey, regardless of your political or other leanings, it's a good idea for everyone to conduct some due diligence background research, and to not blindly be believin' (especially not anything that you read online, because I hate to break it to you, but not everything on the internet is true!).

Image source: me.me
When I first saw the above graph – of the cherry blossom dates over 1,200 years – in the mainstream media, I assumed that the data points all came from a nice, single, clean, consistent source. Like, you know, a single giant tome, a "cherry blossom codex", that one wizened dude in each generation has been adding a line to, once a year, every year since 812 CE, noting down the date. But even the Japanese aren't quite that meticulous. The real world is messy!
According to the introductory text on the page from Osaka Prefecture University, the pre-modern data points – defined as being from 812 CE to 1880 – were collected:
… from many diaries and chronicles written by Emperors, aristocrats, goveners and monks at Kyoto …
For every data point, the source is listed. Many of the sources yield little or no results in a Google search. For example, try searching (including quotes) for "Yoshidake Hinamiki" (the source for the data points from 1402 and 1403), for which the only results are a handful of academic papers and books in which it's cited, and nothing actually explaining what it is, nor showing more than a few lines of the original text.
Or try searching for "Inryogen Nichiroku" (the source for various data points between 1438 and 1490), which has even fewer results: just the cherry blossom data in question, nothing else! I'm assuming that information about these sources is so limited, mainly due to there being virtually no English-language resources about them, and/or due to the actual titles of the sources having no standard for correct English transliteration. I'm afraid that, since my knowledge of Japanese is close to zilch, I'm unable to search for anything much online in Japanese, let alone for information about esoteric centuries-old texts.
The listed source for the very first data point of 812 CE is the Nihon Kōki. That book, along with the other five books that comprise the Rikkokushi – and all of which are compiled in the Ruijū Kokushi – appears to be one of the more famous sources. It was officially commissioned by the Emperor, and was authored by several statesmen of the imperial court. It appears to be generally considered as a reliable source of information about life in 8th and 9th century Japan.
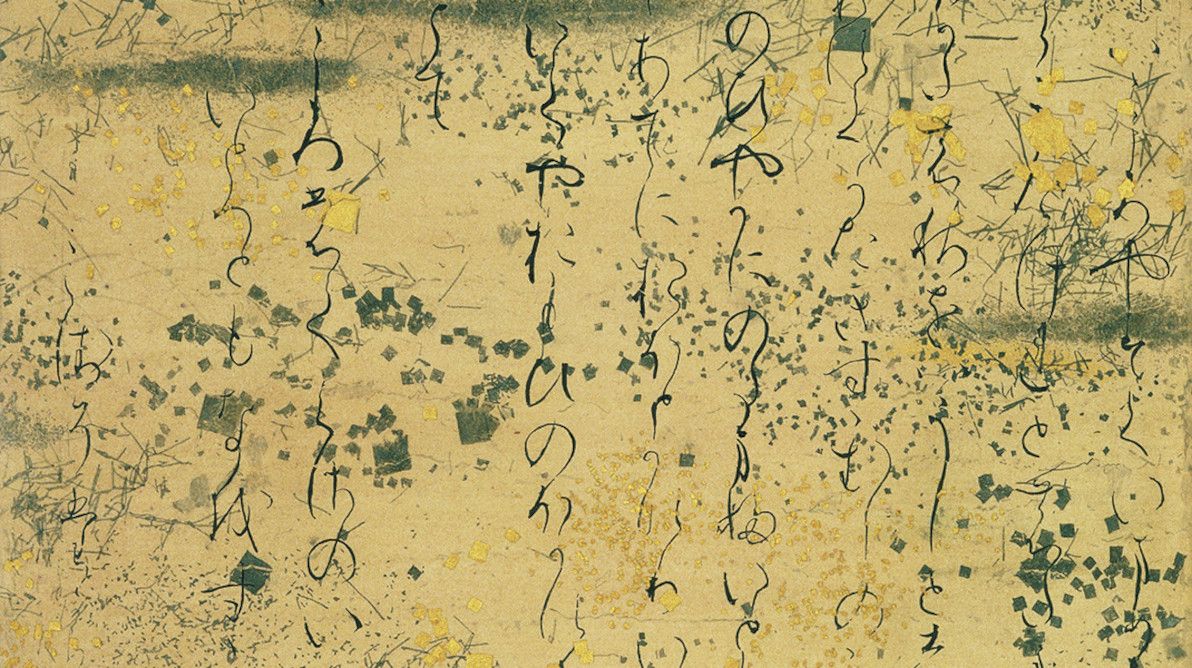
Image source: Wikimedia Commons
The data points from 812 CE to 1400 are somewhat sporadic. There are numerous gaps, sometimes of as much as 20 years. Nevertheless, considering the large time scale under study, the data for that period is (in my unqualified layman's opinion) of high enough frequency for it to be statistically useful. The data points from 1400 onwards are more contiguous (i.e. there are far fewer gaps), so there appears to have been a fairly consistent and systematic record-keeping regime in place since then.
How much you want to trust the pre-modern data really depends, I guess, on what your opinion of Japanese civilisation is. When considering that matter, bear in mind that the Imperial House of Japan is believed to be the oldest continuous monarchy in the world, and that going back as far as the 8th century, Japan was already notable for its written works. Personally, I'd be willing to give millenium-old Japanese texts the benefit of the doubt in terms of their accuracy, more than I'd be willing to do so for texts from most other parts of the world from that era.
The man behind this data set, Yasuyuki Aono, is an Associate Professor in Environmental Sciences and Technology at Osaka Prefecture University (not a world-class university, but apparently it's roughly one of the top 20 universities in Japan). He has published numerous articles over his 30+ year career. His 2008 paper: Phenological data series of cherry tree flowering in Kyoto, Japan, and its application to reconstruction of springtime temperatures since the 9th century – the paper which is the primary source of much of the data set – is his seminal work, having been cited over 250 times to date.
So, the data set, the historical sources, and the academic credentials, all have some warts. But, in my opinion, those warts really are on the small side. It seems to me like pretty solid research. And it appears to have all been quite thoroughly peer reviewed, over numerous publications, in numerous different journals, by numerous authors, over many years. You can and should draw your own conclusions, but personally, I declare this data to be trustworthy, and I assert that anyone who doubts its trustworthiness (after conducting an equivalent level of background research to mine) is splitting hairs.
It don't get much simpler
Having got that due diligence out of the way, I hope that even any climate change sceptics out there who happen to have read this far (assuming that any such folk should ever care to read an article like this on a web site like mine) are willing to admit: this cherry blossom data is telling us something!
I was originally hoping to give this article a title that went something like: "Five indisputable bits of climate change evidence". That is, I was hoping to find four or so other bits of evidence as good as this one. But I couldn't! As far as I can tell, there's no other record of any other natural phenomenon on this Earth (climate change related or otherwise), that has been consistently recorded, in writing, more-or-less annually, for the past 1,000+ years. So I had to scrap that title, and just focus on the cherry blossoms.
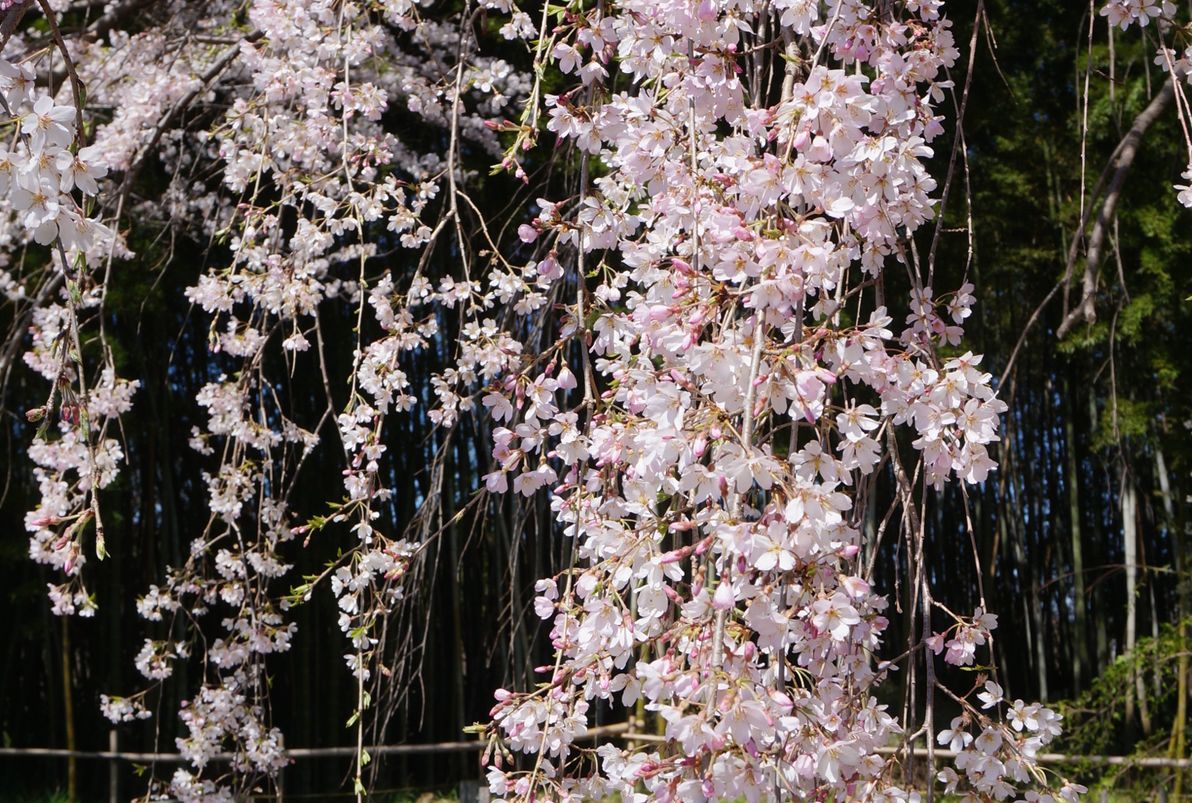
Image source: Wikimedia Commons
Apart from the sheer length of the time span, the other thing that makes this such a gem, is the fact that the data in question is so simple. It's just the date of when people saw their favourite flower bloom each year! It's pretty hard to record it wrongly – even a thousand years ago, I think people knew what day of the year it was. It's not like temperature, or any other non-discrete value, that has to be carefully measured, by trained experts, using sensitive calibrated instruments. Any old doofus can write today's date, and get it right. It's not rocket science!
That's why I really am excited about this cherry blossom data being the most indisputable evidence of climate change ever. It's not going back 200 years, it's going back 1,200 years. It's not projected data, it's actual data. It's not measured, it's observed. And it was pretty steady for a whole millenium, before taking a noticeable nosedive in the 20th century. If this doesn't convince you that man-made climate change is real, then you, my friend, have well and truly buried your head in the sand.