Introducing: World Locality Transit Graph
I built a dataset and map visualisation called the World Locality Transit Graph. Source code is on GitHub. It's a map of approximate transit times between any two given localities in various parts of the world.
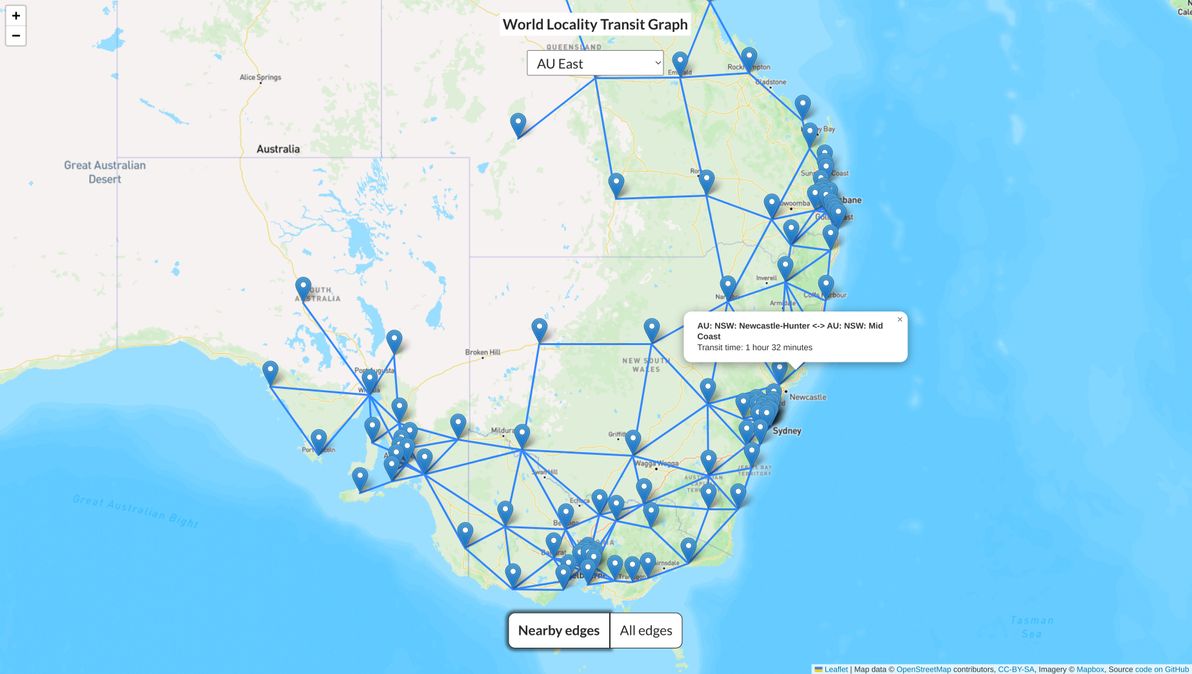
About the graph
(Note: this section is copied from the README that can be seen on GitHub.)
A "locality", for the purposes of the graph, is:
- In a large metropolitan area: a group of neighbourhoods / suburbs, e.g. "inner city", "southern suburbs"; such a locality should (as a rough guide) be 15-30 minutes transit time from its adjacent metropolitan localities
- In a (small urban area or) semi-rural area: the whole main town / city, and usually also neighbouring towns / countryside, e.g. "foobar valley", "fizzbuzz peninsula"; such a locality should (as a rough guide) be 1-2 hours transit time from its adjacent semi-rural localities
- In a remote rural area: all of the towns / countryside within a large area, e.g. "far north", "highlands"; such a locality should (as a rough guide) be 3-5 hours transit time from all adjacent localities
Additionally, regardless of whether it's big-city or middle-of-nowhere:
- Someone who lives in one locality, should consider anyone living in the same locality as being "in my area" (folks in a city of several million people have quite a different definition of "in my area", compared to folks whose next-door neighbour is over the horizon!)
- Each locality should have its own identity, both geographical and cultural; a person who lives in a locality should feel some connection (could be positive or negative!) to their locality's identity
Each locality is represented as a node in the graph. Two localities should be connected as "nearby edges" (i.e. there should be an edge connecting their nodes in the graph) if and only if:
- They are geographically adjacent
- It's possible to travel between them using one or more spontaneous transport modes, e.g. private car, some trains / buses / ferries, walking, bicycle, taxi (not non-spontaneous transport, i.e. not transport that has to be booked in advance, that may have infrequent service, and that may not be available 24/7, e.g. flights, some trains / buses / ferries)
- Travel between them using the fastest available spontaneous transport mode is no more than approximately 5 hours (under ideal conditions, i.e. very low traffic, no adverse weather, no roadwork / trackwork)
There is also an edge for every single possible pair of localities (in each connected graph), with a transit time of up to 5.5 hours, which can be seen in the "all edges" map view. These edges are calculated and generated in advance, using the Floyd-Warshall CSV Generator.
Due to the "5-hour max transit time" rule, and due to the "only spontaneous transport modes" rule, it's actually multiple graphs, not just one graph. This is because there is often no way to travel between two localities while adhering to those rules, usually due to a body of water being in the way, but sometimes due to a land route being extremely long and desolate (e.g. crossing the Nullarbor Plain between South Australia and Western Australia takes at least 12 hours of non-stop driving).
Why these rules? Because, being a "transit graph", the idea is that it only models "local" travel, i.e. travel that someone would undertake with little or no notice, at little or no financial cost, ideally (for metropolitan localities) local enough that one could still make it back home for the night, or (for rural and semi-rural localities) at least local enough that one could easily complete the journey one-way in a single day.
So, the aim of this graph is to model, for each locality, all of the other nearby localities that are "close enough", in terms of transit time, for casual travel - perhaps to catch up with friends / family, perhaps for local tourism, perhaps for shopping - to be feasible on a regular basis.
Built as a static site, using Leaflet as the map engine, OpenStreetMap for map data, and Mapbox for map tiles. Graph nodes and edges are stored in CSV files in the csv/ directory of the repo.
So far, there is only data for Australia and New Zealand. More world regions coming soon. If you're keen to help out with expanding the dataset, contributions are welcome! Ideally in the form of GitHub pull requests, but otherwise, just get in touch and send me data.
Cool, but why?
I built it primarily because I have another project in mind, that I may or may not build to completion, and which I may or may not be blogging about in future, for which the dataset in this graph would be really useful.
Also: fun!
Also: as far as I'm aware, nothing like this currently exists.
Also: I'd say it's a good thing to have a free, open, and dead-simple dataset like this, that provides a good alternative / good fallback to, for example, Google Maps's route travel time estimates.
Hope you like the World Locality Transit Graph. Feedback welcome.